5 min read
The IPO trap: why the hottest float is usually the worst place for your savings

Article by
Hugo Jonston · Resident Money Writer
Three weeks ago, Space Exploration Technologies (SpaceX) became a public company. It was the biggest float in history, raising about US$75 billion.
The shares were priced at US$135, opened higher, and closed their first day at US$160.95, up roughly 19 percent (5). By 16 June the price had run to US$225.64 and the company was briefly worth more than US$2.6 trillion. A week after that, it was back at US$147 — below its first-day close — a round trip that wiped out more than US$600 billion in value (5). As of this week, the shares sit around US$160, almost exactly where they closed on day one (5). Anyone who bought near the top is still down close to 30 percent.
If you felt the pull to get in on that, you're not foolish. You're human. A rocket company, a famous founder, a chart going straight up, and everyone you follow saying it's going to the moon. That's a powerful combination. But it's worth knowing what the research says happens next, because the SpaceX story is not unusual. It's the rule.
The pop you read about isn't the pop you get
Here's the part that catches people out. When you read that an IPO "jumped 19 percent on day one", that gain mostly went to large institutions who were allocated shares at the offer price the night before. Ordinary investors can't buy at that price. By the time the shares hit your trading app and you can click buy, the pop has already happened. You're buying from the people who got the cheap allocation — often at peak hype, most expensive moment of the stock's life.
That first-day jump, by the way, isn't small. Across IPOs the average first-day gain has historically run around 10 to 15 percent, and in the frothy class of 2021 it averaged 32 percent (1). Great if you were allocated. If you bought after the open, you paid for it.
What the research shows
The long-run picture is well documented, and it isn't kind. The foundational study, by finance professor Jay Ritter, tracked IPOs over the three years after listing. Investors who bought at the first-day closing price and held for three years ended up with about 29 percent less than they'd have made in a comparable basket of established companies — the IPOs returned roughly 34 percent over three years against about 62 percent for the control group (1).
That pattern has held up. More recent work finds around 65 percent of IPOs underperform the wider market over their first three years, with most trailing it by more than 10 percent (2). And the floats don't even reliably hold their offer price: by 2022 nearly 40 percent of recent IPOs were trading below the price they listed at, and by 2023 that had climbed to 54 percent (3). More than half — under water, against the price the insiders chose.
Three floats from the last twelve months
You don't need to reach back to 2012 for examples. Here are three from the past year — different industries, same chart (6).
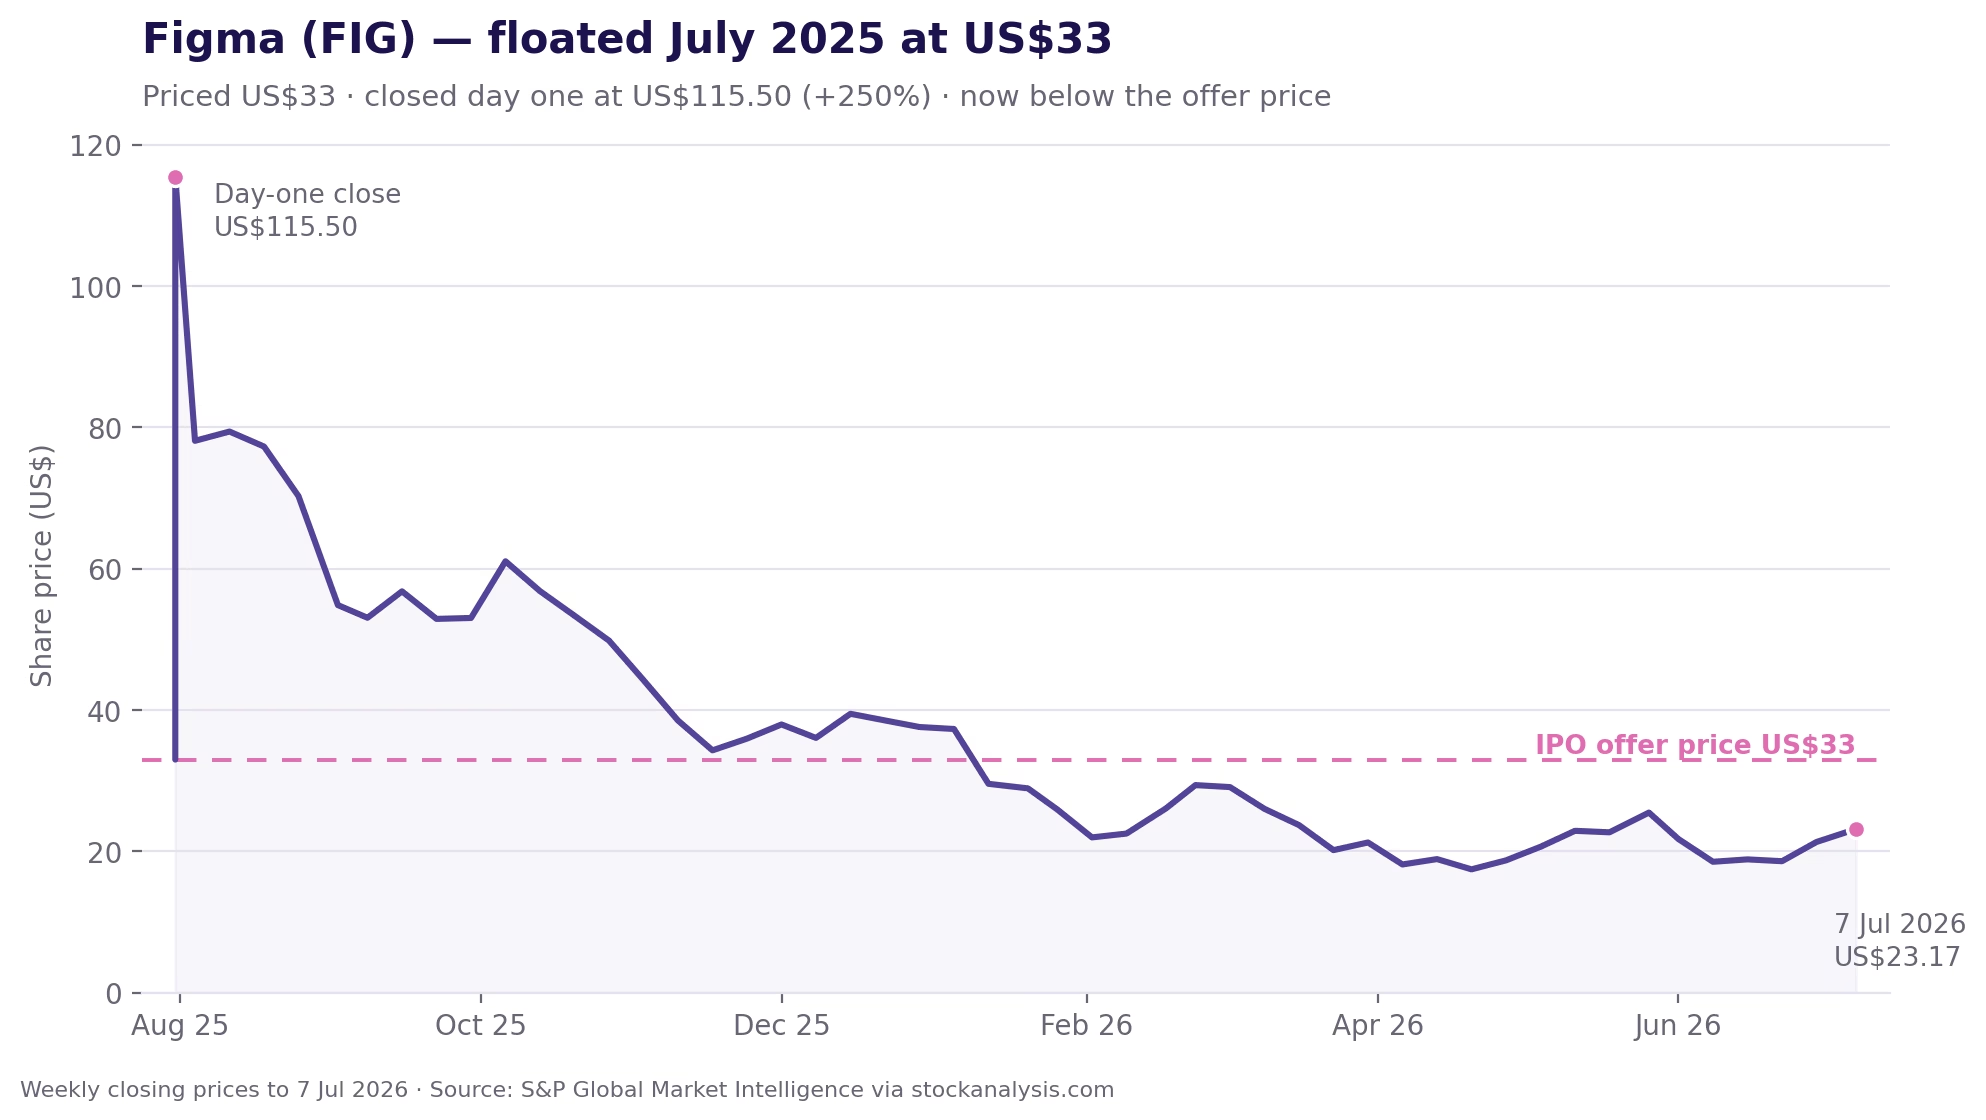
Figma, the design tool, floated in July 2025 at US$33 and closed its first day at US$115.50, a 250 percent pop and one of the biggest debuts in decades (6). Anyone buying at the open paid nearly triple what the insiders were allocated the night before. A year on, the shares trade around US$23 — down about 80 percent from that first-day close, and below the offer price itself.
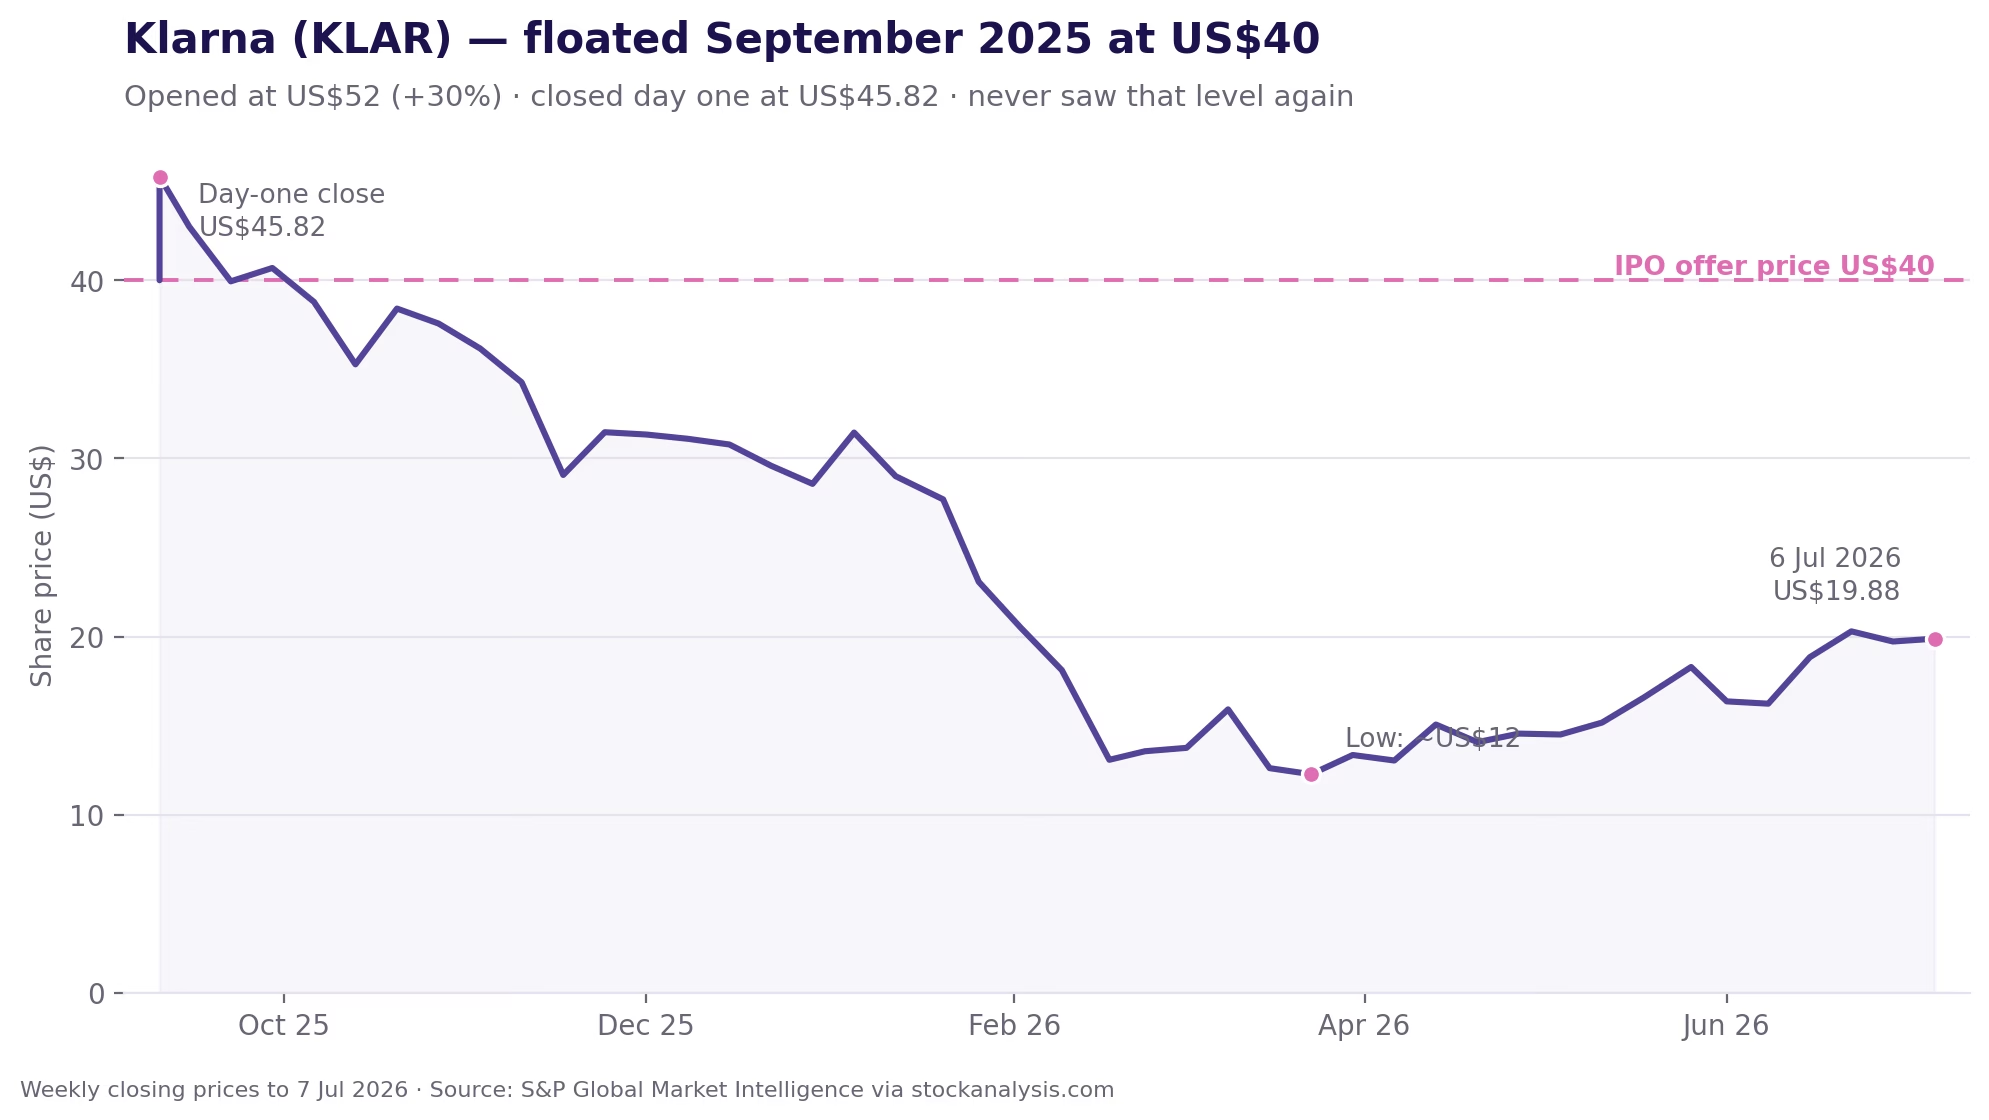
Klarna, the buy-now-pay-later company, floated in September 2025 at US$40 and opened 30 percent higher at US$52 (6). That first morning turned out to be the best moment in the stock's life. It closed day one at US$45.82, never saw that level again, touched about US$12 by March, and now sits near US$20 — half the offer price, well under half what anyone who bought on debut day paid.
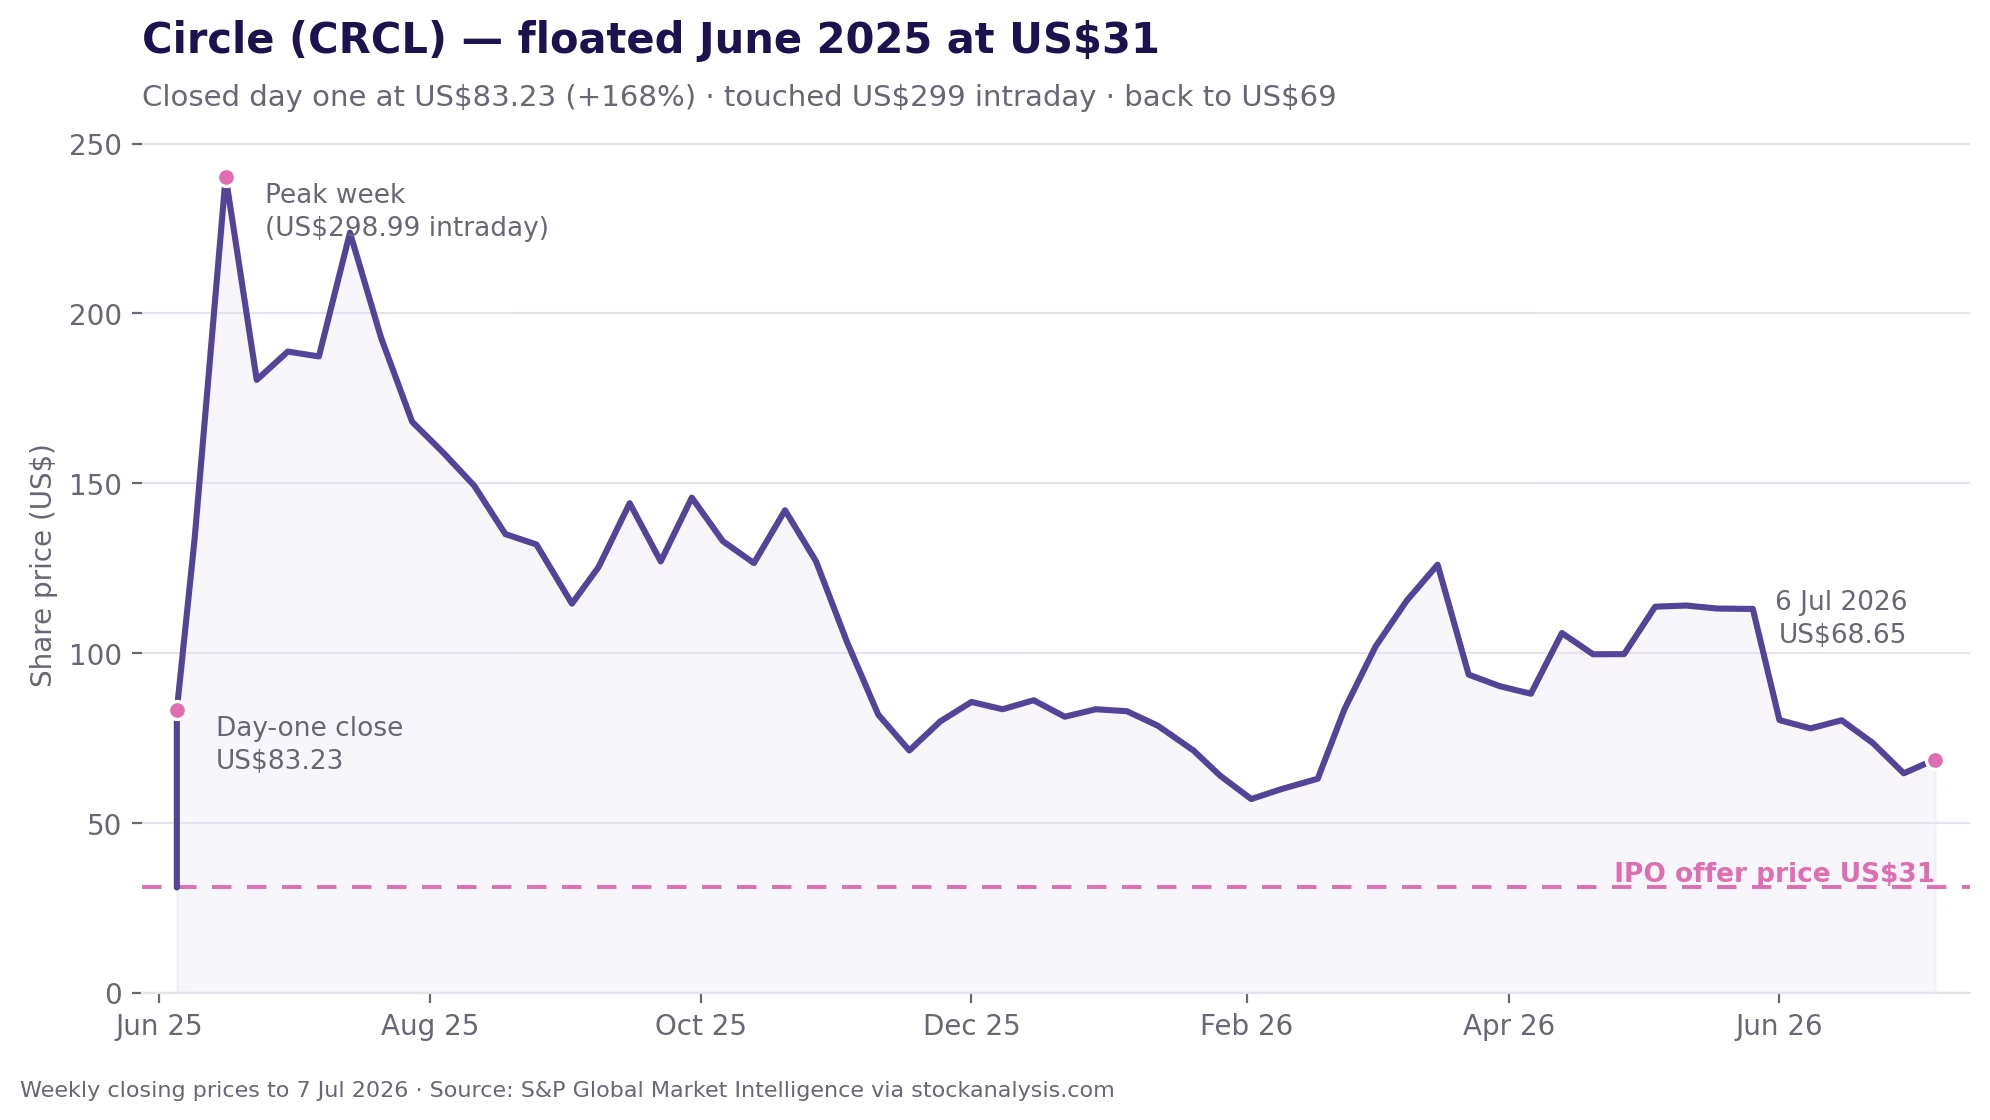
Circle, the company behind the USDC stablecoin, floated in June 2025 at US$31 and closed its first day at US$83.23, up 168 percent (6). Within three weeks it touched nearly US$299 as the hype fed on itself. It now trades around US$69 — still above the offer price, so the institutions did fine, but anyone who bought during that frenzy is down as much as three-quarters.
Three companies, three different stories, one shape: the people allocated at the offer price did well, and the people who bought the excitement paid for it.
The hype has a clock on it
Floats are sold to you at the moment of maximum optimism, because that's when the people who already own the shares — founders, early staff, venture funds — get the best price for the slice they sell. Most of them can't sell everything straight away; they're held back by a "lock-up", usually 90 to 180 days. When it lifts, a wave of insider selling often hits, and the price tends to sag. Across IPOs, roughly 60 percent of stocks fall around their lock-up expiry (4).
Facebook is the cautionary classic. It floated at US$38 in 2012, and as successive lock-ups expired and early holders cashed out, the stock fell below US$18 — more than a 50 percent drop — before it eventually recovered years later (4). Plenty of companies never recover at all.
Carl Thompson, CEO of SortMe, puts it plainly: "The hardest losses we hear about aren't from people who budgeted badly. They're from people who took money they'd carefully saved — a house deposit, a kid's education fund — and put it on one exciting bet because everyone said it couldn't lose. It almost always can."
So what does a calmer plan look like
None of this means markets are a trap or that you should stuff cash under the mattress. It means the exciting, brand-new, everyone's-talking-about-it IPO is close to the worst possible entry point, and the money you can least afford to lose is exactly the money that shouldn't be anywhere near it.
The boring version works better than it has any right to. Money you'll need within a few years sits somewhere safe and boring. Money you're investing for the long run goes in steadily, spread across many companies rather than one, and you leave it alone. It's slower, it doesn't make a good screenshot, and it quietly beats the rocket-stock approach for the overwhelming majority of people who try both.
The first step in all of it is just seeing your whole position clearly — what you've got, what you owe, what you're really saving each month, and what those savings are for. That's the part SortMe is built for: your accounts, your KiwiSaver, your goals and your net worth in one place, so a decision about risk is one you make with the full picture in front of you, not in the heat of a chart that's going vertical. A goal with a number and a date attached is a lot harder to gamble away on a Friday afternoon.
The IPO will always look like the chance you can't miss. The data, and anyone who bought SpaceX at US$225, says otherwise.
SortMe is a budgeting and cashflow tool, not a financial adviser or investment platform. This article is general information, not personal financial advice. If you're making investment decisions, consider talking to a licensed financial adviser about your own situation.
Sources
- Jay R. Ritter (University of Florida) — The Long-Run Performance of Initial Public Offerings (Journal of Finance, 1991) and updated IPO statistics (average first-day returns; 3-year buy-and-hold underperformance of ~29% vs comparable established companies) — site.warrington.ufl.edu/ritter — IPO data
- Nasdaq — What Happens to IPOs Over the Long Run? (~65% of IPOs underperform the market over their first three years, most trailing by more than 10%) — nasdaq.com — IPOs over the long run
- Jay R. Ritter — updated IPO statistics (share of recent IPOs trading below offer price: ~39.5% in 2022, ~53.7% in 2023) — site.warrington.ufl.edu/ritter — IPO data
- Academic lock-up expiration studies (~60% of IPO stocks decline around lock-up expiry); Facebook's 2012 float: US$38 offer falling below US$18 as successive lock-ups expired — en.wikipedia.org — Facebook IPO
- SpaceX (SPCX) float and price history (US$135 offer, 12 Jun 2026; US$160.95 first-day close, +19.2%; US$225.64 high, 16 Jun; US$147.11 low, 23 Jun; ~US$600B one-week value loss; ~US$160 as at early Jul 2026) — CNBC, TradingView, Investing.com — finance.yahoo.com — SPCX
- Figma (FIG), Klarna (KLAR) and Circle (CRCL) float and price histories (offer, day-one close, peak and current prices; chart series are weekly closing prices to 7 Jul 2026, S&P Global Market Intelligence) — Bloomberg, Yahoo Finance, Secfi, IG, MacroTrends — stockanalysis.com — FIG / KLAR / CRCL