5 min read
The SortMe Cashflow Health Score: what it is and how it's calculated

Article by
Hugo Jonston · Resident Money Writer
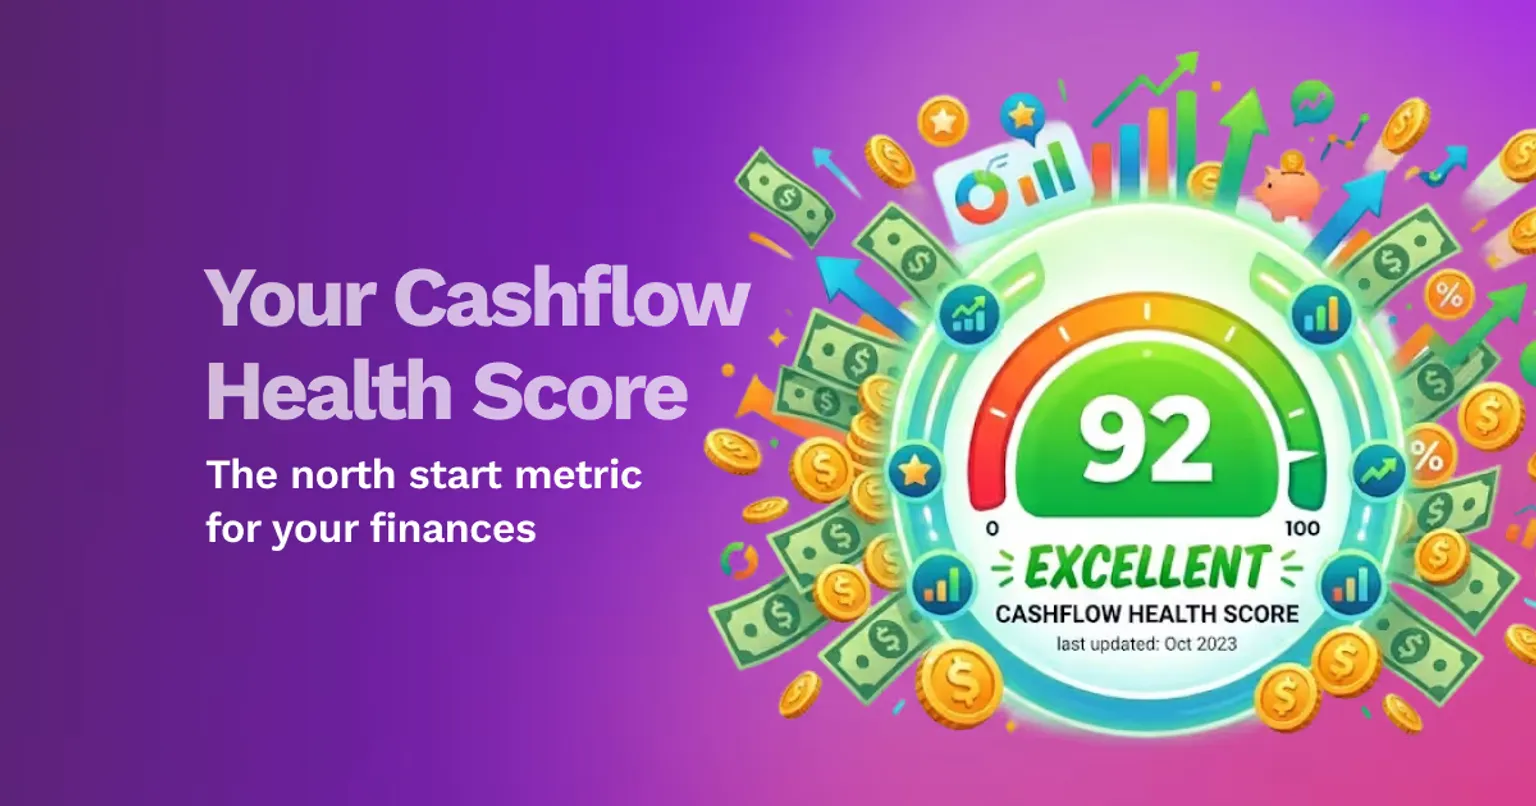
Most NZ households have a credit score and no idea what it is. They also have a cashflow position they look at once a month and interpret from vibes. One of these numbers gets checked when you apply for a mortgage. The other one actually runs your life.
The SortMe Cashflow Health Score is the second number, put on a consistent 0–100 scale so the household can see at a glance whether the cashflow position is healthy or quietly fraying. This is what the score actually measures, how it’s calculated, and what it’s useful for.
Why a single number
Cashflow is multi-dimensional, but in practice almost everything that determines whether a household will be okay comes down to two questions. Are you living within your means? And if income stopped tomorrow, how long would you last?
The first is a flow question — income versus expenses, sustained over time. The second is a stock question — how much cash you actually have sitting there as a buffer.
Either one on its own gives you a misleading picture. A household saving 25% of its income but with $400 in the bank is one bad month from a crisis. A household with $80,000 in savings but spending more than it earns each month is on a slow-moving slide. The score combines the two so the headline number can’t lie to you in either direction.
What the Cashflow Health Score measures
The score is built from two sub-scores, combined with a 60/40 weight, then potentially reduced if your cash buffer is dangerously thin.
1. The Spending sub-score (60% of your cashflow health score). A measure of how much of your income you’re keeping. SortMe takes your declared monthly income and your budgeted expenses, annualises both, folds in any one-off income or expense events you’ve planned, and works out your surplus ratio — the share of annual income you don’t spend.
Spending exactly what you earn lands you around a 30 on this sub-score. Saving roughly 20% of your income — $1 in every $5 — gets you to the cap of 100. Spending more than you earn drops the score below 30 and bottoms out at zero. The curve is steep on purpose: small movements in the surplus ratio meaningfully shift the score.
2. The Buffer sub-score (40% of your cashflow health score). A measure of how many months of expenses you could cover from cash on hand if income stopped today. SortMe takes the latest known balance across your connected cash accounts and divides it by your monthly expenses.
The mapping is straightforward: no buffer scores zero, one month scores 40, three months scores 80, six months scores 100. Anything beyond six months is treated the same as six — past that point, additional cash isn’t really making your day-to-day cashflow healthier, it’s just savings.
3. The low-buffer penalty. If you’ve got less than one full month of cash buffer, the combined score is multiplied by a number that slides from 0.5× (no buffer at all) up to 1× (a full month of buffer). The intent is simple: a household with a great surplus ratio but literally no savings can’t sit in the top bands, because one bad month would wipe it out.
That’s the whole formula. No bill-payment timing index, no credit data, no net worth, no investment performance. The cashflow health score is deliberately the two things the majority of financial advisors agree actually matter: spending and cushion.
What counts as a “cash account”
For the buffer half of the score, SortMe only looks at connected cash accounts — your everyday transaction accounts and savings accounts. KiwiSaver, credit cards, loans, home-loan offset facilities, and IRD balances are all excluded.
That’s a deliberate choice. KiwiSaver isn’t accessible cushion for most households. Offset accounts and credit limits aren’t savings, even though they show as positive numbers in some apps. The score reflects the buffer you could actually spend in a crunch, not the one your net-worth statement might flatter.
How the score recalculates
Every time you load the Forecast page or the Cashflow widget on your Financial Overview, the score is recomputed from scratch — your latest income, your latest budget, your latest balance, your latest one-off entries. There’s no overnight job, no cached value sitting on a stale snapshot of last week. Edit your budget and the score reflects it on the next page load.
The trade-off is that the score is, today, a snapshot rather than a trendline. The product currently doesn’t store a history of past scores or show a chart of your score over time. That’s something on the roadmap, but worth knowing now — the score is best read alongside your own sense of whether things are getting better or worse.
The Cashflow Health Score is forward-looking
One detail worth understanding: the score uses an annualised, 12-month view of your finances. Monthly income and expenses are multiplied out for the year, and any one-off entries you’ve added to your budget — a planned holiday in three months, an expected tax refund, a Christmas spend — are folded into the annual totals.
That means a planned $5,000 holiday in March will drag today’s January score down a touch, because over the 12-month window it’s part of what you’re spending. This is the opposite of how most apps work, and it’s the right way around. The score should reflect what you’re actually committed to spending, not just what’s already left your account.
What a score looks like
The 0–100 score is grouped into five labelled bands:
- 86–100. Excellent. Living within your means with room to spare, and a solid cushion behind you. Almost always means both a healthy surplus ratio and around six months of cash buffer — you can’t reach this band on one of those alone.
- 71–85. Very Good. Comfortably positive margin and a meaningful buffer. Most well-organised households sit here.
- 51–70. Good. A real surplus and a real buffer, but one or both has room to grow.
- 31–50. Needs Attention. Either a slim margin between income and expenses, or a margin that’s positive but undermined by a thin cash cushion.
- 0–30. Poor. Expenses are close to or exceeding income, or the cash position is so thin a single bad month would be a crisis.
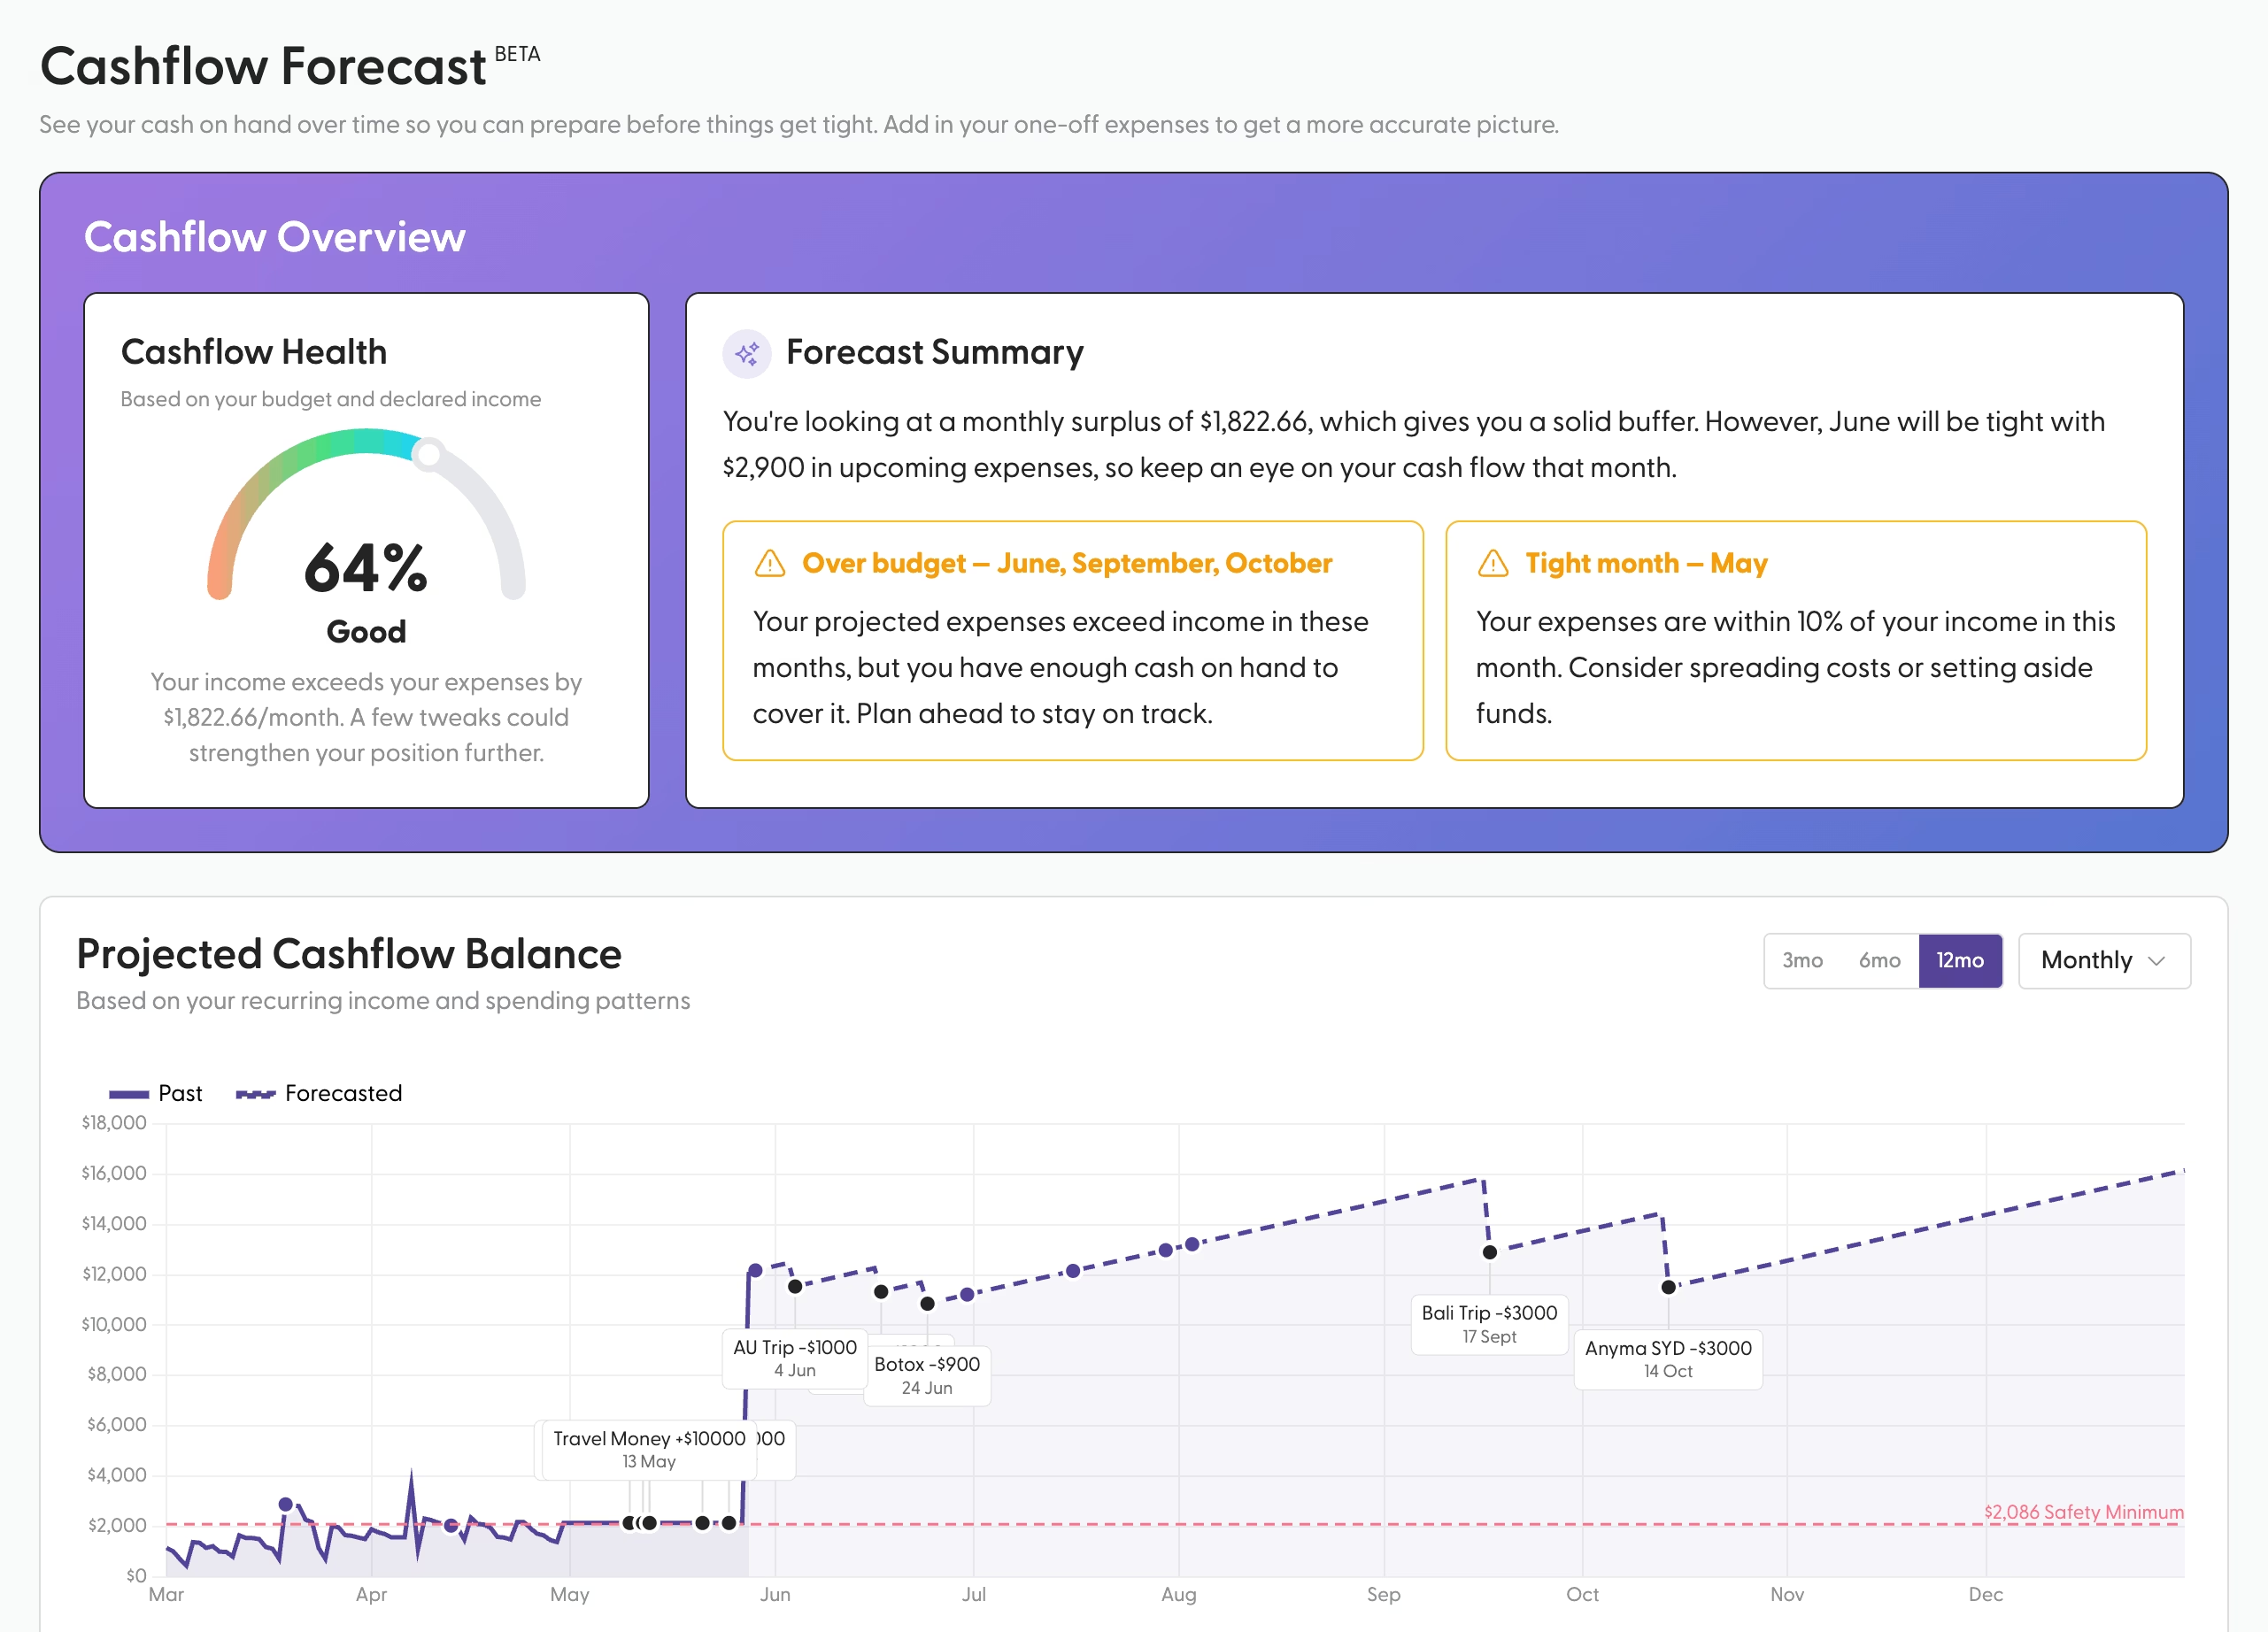
Underneath the gauge, SortMe shows a one-line read-out of where the pressure is — for example, “Your income exceeds your expenses by $X/month, but the margin is slim.” The number is the signal; the line underneath tells you which lever to pull.
Where you’ll see it in SortMe
Two places. There’s a semicircular gauge on the Forecast page that shows the full score, its band, and the one-line feedback sentence. And there’s a small Cashflow Health pill on the Financial Overview’s Cashflow widget that shows the headline number and links through to the gauge for the detail. Both are available wherever you have access to the Forecast page.
The things the score is not
Four things the Cashflow Health Score is explicitly not.
It is not a credit score. Credit scores live with credit reporting agencies (Centrix, Equifax in NZ) and reflect your borrowing history (1). The Cashflow Health Score is an internal household view — it doesn’t affect your ability to borrow and it isn’t shared.
It is not a complete financial health rating. A strong score doesn’t mean you’re investing well, insured adequately, or on track for retirement. It means the two cashflow fundamentals are in shape — a necessary but not sufficient condition for the rest.
It is not a judgement. Households go through seasons. A score of 45 during a tough year doesn’t define the household; it just tells you where the pressure is.
It is not static. It’s recomputed on every page load. Update your budget or balance and the next view reflects it.
Carl Thompson, Founder and CEO of SortMe, says:
“Your credit score tells a bank whether you’re safe to lend to. In no way does it represent how good you are with your money. Your Cashflow Health Score tells you what shape your household cashflow is actually in. A much more meaningful metric to focus on.”
How to actually improve the score
Because there are only two sub-scores, there are only two levers — but each has a few honest options. These are fundamental to good cash flow, so focusing on improving these will have a huge effect on your financial situation.
Lift the surplus ratio. Either spend less or earn more. The lift is the same whether it comes from cancelling subscriptions, switching to cheaper groceries, killing eating-out spend, or taking on extra income. Anything that moves annual income above annual expenses by another percentage point or two moves the spending sub-score noticeably.
Grow the cash buffer. Set up an automated weekly sweep into a separate cash savings account. The breakpoints to aim for are one month (where the low-buffer penalty stops being applied), three months (where you’re at 80 on the buffer sub-score), and six months (where you cap at 100). Each milestone meaningfully moves the score.
The fastest improvements usually come from the cash-buffer side, because the low-buffer penalty multiplies the whole score. A household with a strong surplus ratio but $0 saved can roughly double its score by reaching a one-month buffer. That’s how important a savings buffer (aka emergency fund) is.
Who the score matters most to
The score matters most to households in the middle of the spectrum — solid income, meaningful but not crushing obligations, a goal (a house, retirement, financial independence) they’re working towards but haven’t fully mapped. The score is the compass that tells them whether the direction they’re heading is the one they think they’re heading.
Households at both ends — genuine hardship, genuine abundance — the score still reports, but the actions it suggests matter less. For the middle 60% of NZ households, it’s the most useful summary view SortMe has built.
The practical next step
Connect a cash account, set up your income, your budget, and add in your one-off incomes and expenses. The Cashflow Health Score appears on your Forecast page immediately — there’s no waiting period.
See your Cashflow Health Score in SortMe at sortme.com.
Sources
- Your credit report — NZ, Consumer Protection NZ — consumerprotection.govt.nz