5 min read
Is the share market bubble about to burst? What a crash really means for NZ investors

Article by
Hugo Jonston · Resident Money Writer
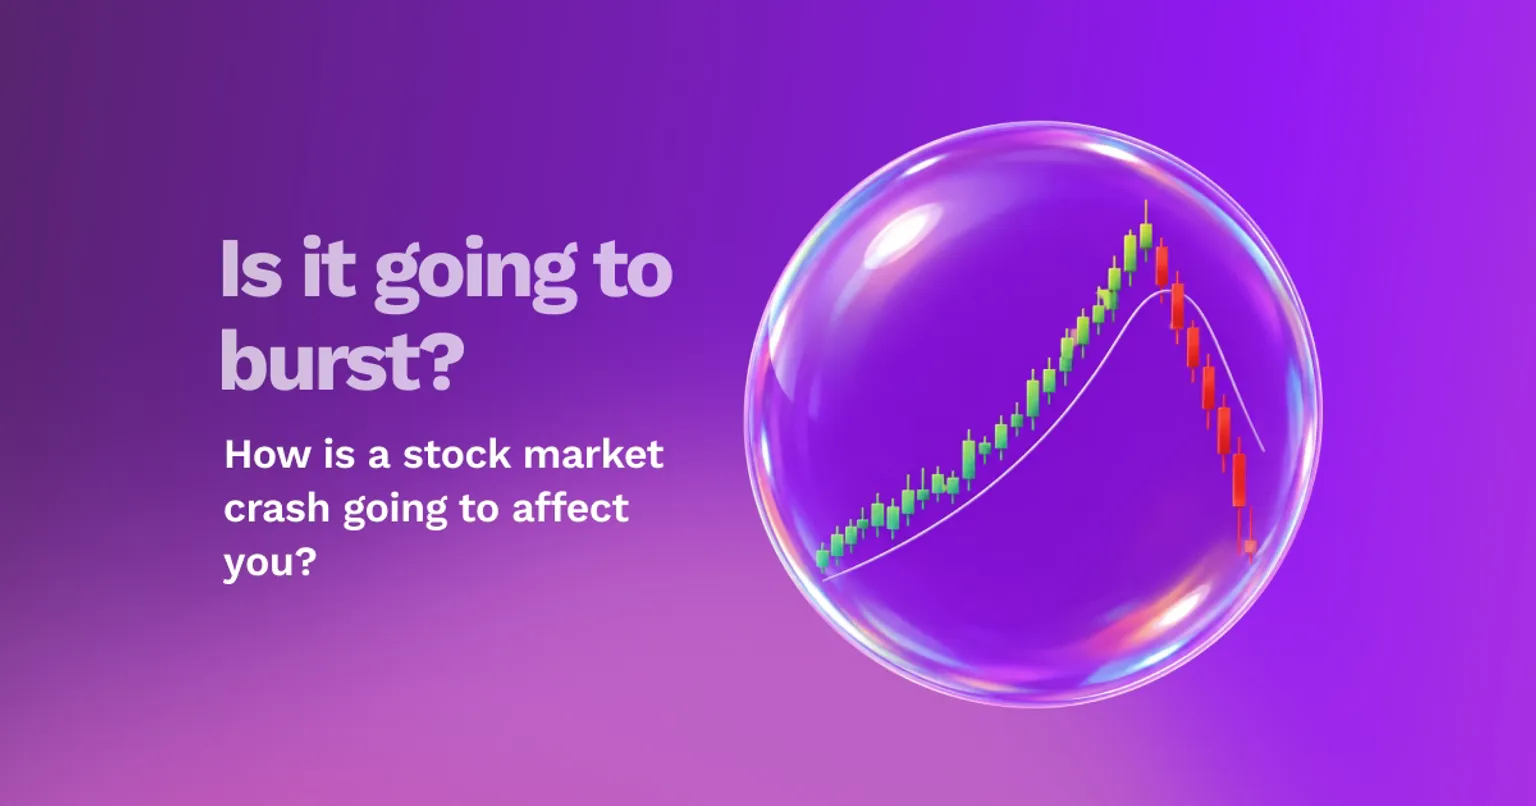
The question turns up everywhere at the moment. In the headlines, in the group chat, from the friend who has never mentioned shares in his life and suddenly wants to know whether he should pull his KiwiSaver out of Growth. Is this an AI bubble? Is it about to pop?
Here is the honest answer, and it's worth sitting with for a second: nobody knows. Not the fund managers, not the strategists, not us.
We can prove that. Bank of America surveys global fund managers every month — the July 2026 round covered 210 of them running about US$555 billion between them. For the first time, an "AI bubble" topped their list of biggest tail risks, named by 45%, up from 28% in June. Then the survey asked them straight out whether AI stocks are in a bubble. 43% said yes. 48% said no (1).
That's the state of expert opinion: a coin flip, held by people with Bloomberg terminals and research teams. If they can't agree, no article is going to tell you what happens next, and you should be suspicious of any that tries.
So let's ask a better question. Not will it crash, which is unknowable, but what would a crash do to me — which is entirely knowable, today, before anything happens.
What the froth looks like right now
Both sides of that 43/48 split have real evidence, and it's worth seeing both.
The case for worry is concentration. The ten largest companies in the S&P 500 now make up somewhere in the mid-to-high thirties as a percentage of the whole index, depending on the day and whose measure you use (2). For most of the period from 1990 to 2015 that number sat around 18–23%. It has roughly doubled in a decade, and the companies doing the doubling are largely the same AI and mega-cap technology names. When you buy "the market" now, you are buying a much more concentrated bet than your parents were. The same BofA survey found 82% of managers calling "long global semiconductors" the most crowded trade in the market, a record (1). Crowded trades unwind badly.
The case against panic is that the earnings are real. Unlike 1999, the companies at the centre of this are enormously profitable, and much of the AI spending is being funded from operating cash flow rather than debt. A bubble financed with borrowed money fails differently, and far more violently, than one financed with cash. Where froth does show up cleanly is at the speculative edge — the hot new float is a better example of it than the mega-caps are.
Both things are true at once. That is usually how it is.
What history rhymes with
Two episodes are worth knowing, because they bracket the range.
The dot-com bust. The Nasdaq peaked in March 2000 and fell roughly 78% over the next two and a half years. It did not reclaim that level until 2015 — about fifteen years (3). That's the bad case, and the reason it was so bad is instructive: a great many of those companies had no earnings at all. When the money stopped, there was nothing underneath.
The GFC. The S&P 500 fell about 57% from its October 2007 peak to the March 2009 trough, and was back at a new high by early 2013 — around five and a half years, start to finish (3).
Two lessons fall out of that. The first is that recovery time varies enormously, and "the market always comes back" is true but does a lot of quiet work in that sentence. Fifteen years is a long time to be waiting if you needed the money in year three. The second is that the depth of the fall tracked how much of the price was supported by real earnings. That's the question worth asking about any bubble, including this one.
Anatomy of a 30% drop
Forget percentages for a moment and use your own number.
Say you have $80,000 across KiwiSaver and a Sharesies account, sitting in growth assets. A 30% fall takes it to $56,000. You lose $24,000. And you lose it while continuing to go to work, pay the mortgage and read headlines telling you it will get worse.
It doesn't happen in a day, either. It grinds. A bad week, a bounce that feels like relief, another bad month, and the slow arrival of the thought this time is different, I should stop the bleeding. That thought is the real danger. In 2008, the people who were permanently damaged were not the ones who held on; they were the ones who sold at the bottom and were still in cash when it turned back upward.
Now, the important part. Whether that $24,000 matters depends entirely on one thing, and it isn't your view on AI.
It's your time horizon, not your forecast
If that money is your house deposit for next March, a 30% drop is a genuine emergency. You don't get to wait five years. You have to sell into the fall and crystallise the loss, and no amount of long-run averages helps you.
If it's your KiwiSaver and you're 34, the same 30% drop is closer to a non-event, and arguably good news, because every contribution for the next while buys more units at lower prices. You have thirty years for it to matter, and history says that's usually enough.
Same drop. Same portfolio. Opposite meaning. The variable is time, and time is something you already know without predicting anything.
One honest caveat, because we'd rather be right than reassuring: "it averages out over 30 to 50 years" is broadly supported by history, but it isn't a law of nature, and it hides a real risk called sequence-of-returns. If a big fall lands right as you start drawing the money down — early retirement, say — you're selling units at the worst possible prices and the long-run average never gets a chance to rescue you. Long horizons are forgiving. The years either side of retirement are not.
The bit most people get wrong
There's a habit of collapsing two different questions into one: how much risk can I stomach and how concentrated am I. They aren't the same question.
Risk tolerance is about your mix — how much sits in growth assets versus bonds and cash. That should follow your horizon and what the money is for.
Concentration is different, and it's everyone's problem. Plenty of New Zealanders think they're diversified because they hold a fund, a KiwiSaver and a few picks, and don't realise all three are largely riding the same handful of US technology companies. If your KiwiSaver Growth fund, your index fund and your individual shares all lean the same way, you own one bet in three wrappers. That's not diversification, that's repetition. Spreading across regions and asset classes is the fix, and it's as relevant to the aggressive 28-year-old as to the cautious 58-year-old. It helps to know where Sharesies, Hatch and Kernel each fit, because they don't all give you the same spread.
What to do before anything happens
Nothing here requires a view on whether the bubble pops.
Know your real exposure. Not "I'm in Growth" — the real figure: how much of your wealth is riding on the same dozen companies, across every account you hold. What your KiwiSaver fund holds is where most people get their surprise.
Know your buffer. Cash you won't be forced to sell into a fall to access. This is what turns a crash into a headline instead of an event.
Match money to time. Anything you need within about three years shouldn't be riding on a market. Anything you don't need for thirty can afford to.
Decide now what you'll do if it falls 30%. Write it down. Decisions made in calm are better than the ones made at 11pm in a red month.
Where SortMe comes in
The reason most people can't answer "how exposed am I?" is not laziness. It's that the answer is scattered — the KiwiSaver is with one provider, the shares are on Kernel or Hatch, the cash is across two banks, and nothing adds it up.
SortMe connects your bank accounts, KiwiSaver and investment platforms and puts the whole picture on one screen — the same net worth picture you'd otherwise be assembling by hand across five logins. That gives you the two numbers this article is about: what you're really holding, and how much cash you'd have to lean on if markets fell. Most people are surprised by at least one of them.
SortMe is read-only. It never trades for you, and it has no view on the market. Its job is to make your position legible while things are calm, which is the only time it's easy to look.
Before you change anything
This is general information, not personalised financial advice, and SortMe isn't a financial adviser. Nothing above is a prediction, and nobody should be reallocating a portfolio on the strength of a blog post. If your situation is complicated, or the money is close at hand, that's a conversation for a licensed adviser, and SortMe can connect you with one if you'd like.
The useful move isn't guessing. It's making sure that whatever the market does next, you already know what it means for you.
If you want to see your full picture — banks, KiwiSaver and investments on one screen — you can try SortMe for $1 for 7 days at sortme.com.
Sources
- BofA Global Fund Manager Survey, July 2026 (fieldwork 2–9 July 2026; 210 panellists, US$555b AUM) — "AI bubble" named top tail risk by 45%, up from 28% in June; asked directly, 43% said AI stocks are in a bubble and 48% said no; 82% called "long global semiconductors" the most crowded trade, a record — investing.com — Reuters on the BofA survey; seekingalpha.com — AI bubble fears climb to top market risk
- S&P 500 top-10 concentration (roughly 36–38% of index market cap as at July 2026, against about 23% in 2000; figures vary by measure and date) — spglobal.com — S&P 500 Top 10 Index
- Dot-com and GFC drawdowns (Nasdaq peaked 10 Mar 2000, fell about 78% by Oct 2002, reclaimed 23 Apr 2015; S&P 500 fell about 57% Oct 2007–Mar 2009, new closing high 28 Mar 2013) — en.wikipedia.org — Dot-com bubble; en.wikipedia.org — US bear market of 2007–2009
- SortMe — bank, KiwiSaver and investment integrations (Sharesies, Hatch, Kernel) — sortme.com